

I am new to Kotlin and Android programming, and somehow I have a hard time to find a really basic MPAndroidChart plugin explanation. Finally, I found the tutorial from the plugin writer himself. You can read it here.
But I want to rewrite the tutorial from a different point of view, and hope that it can help you (especially all the Android dev beginners) to understand about the concept in a better flow.
The Preparation
To add MPAndroidChart to your Android project, open the Gradle Scripts in your project. You will see two “build.gradle” files.
The first one has your project name next to it. Add the “maven” inside the allproject > repositories. This is a plugin to build your app as well as build libraries. As we’re going to add library in there, so it’s logical that we add the maven plugin to help us with that.
allprojects {
    repositories {
        ...
        maven { url 'https://jitpack.io' }
    }
}
The second one has “Module: app” text next to it. Add the MPAndroidChart inside the dependencies.
dependencies {
    ...
    implementation 'com.github.PhilJay:MPAndroidChart:v3.1.0'
}
After this, the Android Studio will notify you that “the Gradle files have changed since last project sync. A project sync may be necessary for the IDE to work properly.” Well, you bet. Click on the “sync now” button on the far top right of the Android Studio screen. And everything is set.
Initializing
For this purpose, we’re going to make Line Chart. Before you begin, you should have two things:
- The data plots
- And the chart view
If you’re new like me, and you might don’t know how to make the chart view, you can either make the chart using IDE or by programming.
If you’re using IDE route, the easiest way is to add any View or Layout. Set it’s positions or constraints properly in Design mode. And then open the Text tab, find that View or Layout, and change the beginning of the tag, from “View” to “com.github.mikephil.charting.charts.LineChart”.
<com.github.mikephil.charting.charts.LineChart
    android:layout_width="match_parent"
    android:layout_height="match_parent"
    android:id="@+id/lineChartView"
    ...>
</com.github.mikephil.charting.charts.LineChart>
And within your function to configure the chart, call it.
val lineChartView = this.lineChartView
If you’re using programming route, here’s the code in init:
val lineChartView = LineChart(this)
setContentView(lineChartView)
The Basics
So the basics of the MPAndroidChart is this:
1. Data
Supposedly we’re going to do the same study case as the tutorial linked above, which is we’re going to display two companies quarterly revenue over a year. You probably already have the data in an array like this:
val revenueComp1 = arrayListOf(10000f, 20000f, 30000f, 40000f)
val revenueComp2 = arrayListOf(12000f, 23000f, 35000f, 48000f)
2. Entry and Entries
Any point inside the chart is encoded in a simple wrapper class called “Entry”. That’s like your most bare foundation where all of this chart data is based upon. The Entry constructor appropriately has two parameters: X and Y.
Any point inside the chart is encoded in a simple wrapper class called “Entry”. That’s like your most bare foundation where all of this chart data is based upon. The Entry constructor appropriately has two parameters: X and Y. The X is for your data. The Y is the reference. For example:
val point1 = Entry(0f, 50f)  // on point/index 0, the data is 50
val point2 = Entry(1f, 100f) // on point/index 1, the data is 100
val point3 = Entry(2f, 75f)  // on point/index 2, the data is 75
So, from the revenue example above, using map, you can convert it into entries (array of Entry)
val entries1 = revenueComp1.mapIndexed { index, arrayList ->
    Entry(index, arrayList[index]) }

val entries2 = revenueComp1.mapIndexed { index, arrayList ->
    Entry(index, arrayList[index]) }
Which you will end up with entries like this:
- entries1: (0, 10000) (1, 20000) (2, 30000) (3, 40000)
- entries2: (0, 12000) (1, 23000) (3, 35000) (3, 48000)
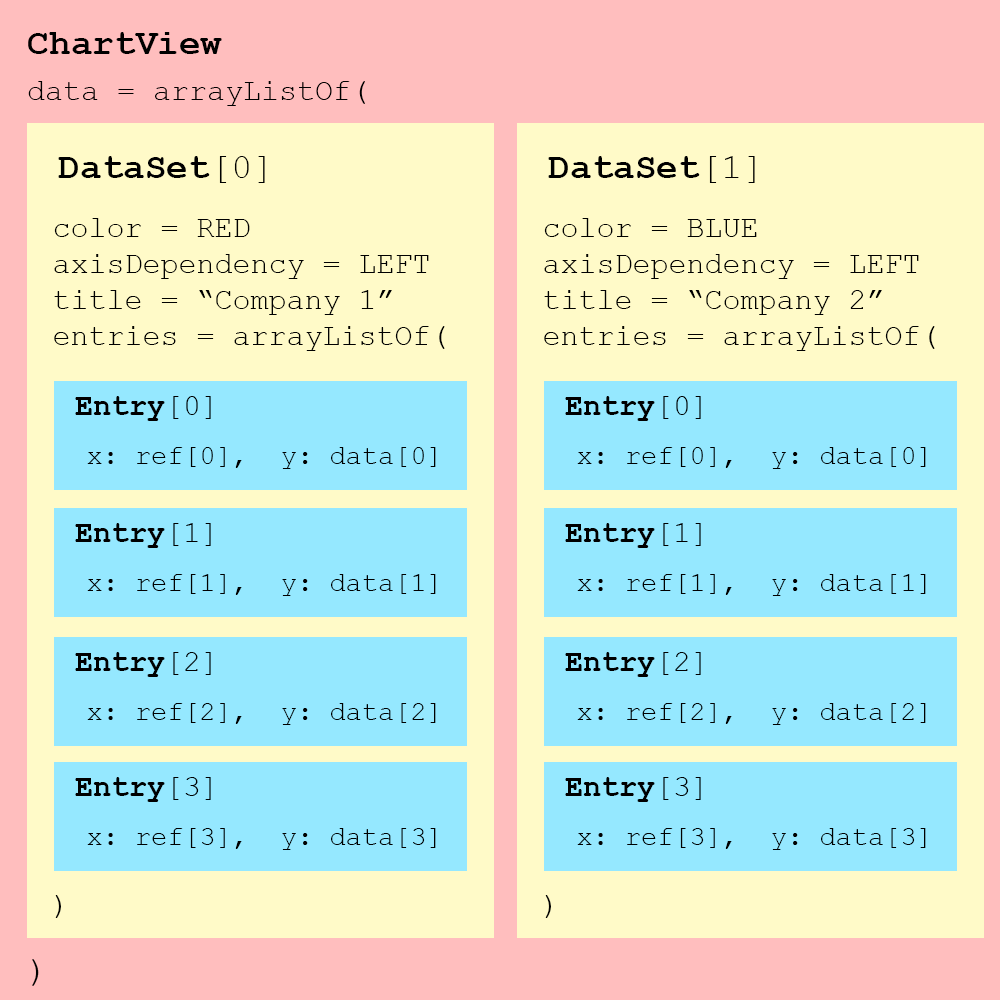
3. DataSets
These entries have to be converted further into DataSets. Data set is a compilation between entries, and many other supporting information to represent the entries, such as:
- Label for Legends (which is set in the constructor)
- The color of the line
- The color of the point circle
- Whether the value of each point is drawn above the point or not
- Even which left/right axis is the orientation of the data
- etc.
val lineDataSet1 = LineDataSet(entries1, "Company 1")
lineDataSet1.color = Color.RED
lineDataSet1.setDrawValues(false)
lineDataSet1.setAxisDependency(AxisDependency.LEFT)↓

val lineDataSet2 = LineDataSet(entries2, "Company 2")
lineDataSet2.color = Color.BLUE
lineDataSet1.setDrawValues(false)
lineDataSet2.setAxisDependency(AxisDependency.LEFT)
Then you can proceed to wrap up all those data sets in a yet another array. This time it’s final.
val lineDataSets = arrayListOf(lineDataSet1, lineDataSet2)
Even if you only have one data set, you still need to wrap it up in an array.
4. Chart
This is it! This is the time for you to supply the data to the chart! Based on the initialization step above, you can use lineChartView object and assign the data to it.
lineChartView.data = lineDataSets
And that’s it! You can have further customization to the chart, like if you want the left Y axis scale from -1 to 1 despite whatever the actual data, you can add this code after it:
lineChartView.axisLeft.mAxisMaximum = 1f
lineChartView.axisLeft.mAxisMinimum = -1f
lineChartView.axisLeft.mAxisRange = 2f
You can also customize the way the value displayed on y axis using value formatter class, for example, to add $ sign before the number. I would not go in depth about that, but if you’re interested, you can read about it here.
Using the similar way, you can also change the label displayed along the X axis. So instead of index 0, 1, 2, 3, you can modify it to display quarter (“Q1”, “Q2”, “Q3″, Q4”) as our use case is to display company revenue quarterly.
5. Refresh the chart view
Even after going through all of that, the chart won’t know when it should refresh its view, not even after you assign the data. You need to manually signal the chart view to refresh its display.
lineChartView.invalidate()
This is better be called at the very end, after all the customization has been assigned.
So that’s it. I hope this helps. This is an overview of the structure. Not a complete structure, but just to wrap things up.
If you have any corrections, suggestions, or questions just type in the comment sections. I’ll help if I can.

Have a good beginning, put this in “allproject > repositories” and that in “Module: app”.
But after the word Initializing are only pieces of code.
I think the xml-file has a failure:
“android:id=”@+id/lineChartView”
…>”
val entries1 = revenueComp1.mapIndexed { index, arrayList ->
Entry(index, arrayList[index]) }
gives me Type mismatch: inferred type is Int but Float was expected
Sad.. The beginning was good.
Andree
I didn’t get that error, but if you do, all you need is just typecasting from the error message you gave me. I don’t know where the error exactly, but I guess it’s on the “arrayList[index]”. So just typecast it into float like this: Float(arrayList[index]). Hope that helps.